import pandas as pd
import os
import csv
import io
import numpy as np
import matplotlib.pyplot as plt
import plotly.express as px
from tqdm.notebook import tqdm
import seaborn as sns
from matplotlib.dates import DateFormatter

import yaml

from sklearn.impute import KNNImputer
import sklearn.impute
from sklearn.ensemble import RandomForestRegressor, RandomForestClassifier
from missforest import MissForest

from imputeMF import imputeMF

from statsmodels.imputation.mice import MICEData
variable = 'temperature_degrees'
df = pd.read_csv('data.csv', parse_dates=True, index_col=0)
# Define the cutoff date
cutoff_date = "2020-09-01"
# Select rows past the cutoff date
df = df[df.index >= pd.Timestamp(cutoff_date)]
# Define the cutoff date
cutoff_date = "2024-08-31"
# Select rows past the cutoff date
df = df[df.index <= pd.Timestamp(cutoff_date)]
# Calculate the percentage of non-missing data for each study site
non_missing_percentage = df.notna().mean() * 100
# Filter study sites with at least 99% non-missing data
selected_sites = non_missing_percentage[non_missing_percentage >= 90].index
df_selected = df[selected_sites]
df_selected.to_csv('tempdata.csv')
df = pd.read_csv('tempdata.csv', parse_dates=True, index_col=0)from sklearn.impute import KNNImputer
imputer = KNNImputer(n_neighbors=19)
df_imputed = df.copy()
df_imputed[:] = imputer.fit_transform(df)params = {'n_estimators': 10,
'max_iter' : 10}
clf = RandomForestClassifier(n_jobs=-1)
rgr = RandomForestRegressor(n_jobs=-1, n_estimators=params['n_estimators'])
imputer = MissForest(clf, rgr, verbose=1, max_iter=params['max_iter'])#df_imputed = df.copy()
df_imputed = imputer.fit_transform(df) 90%|███████████████████████████████████████████████████████████████████████████▌ | 9/10 [01:40<00:11, 11.21s/it]
100%|█████████████████████████████████████████████████████████████████████████████████████| 9/9 [00:29<00:00, 3.29s/it]
def run_experiment(method = 'MF', gap_type = 'continuous', q = 7, p = 1, params=None):

    df = pd.read_csv('tempdata.csv', parse_dates=True, index_col=0)
    df = df.rename(columns = lambda x: 'S_'+x)

    # Define the cutoff date
    cutoff_date = "2020-09-01"

    # Select rows past the cutoff date
    df = df[df.index >=  pd.Timestamp(cutoff_date)]

    # Define the cutoff date
    cutoff_date = "2024-08-31"

    # Select rows past the cutoff date
    df = df[df.index <=  pd.Timestamp(cutoff_date)]

    # Calculate the percentage of non-missing data for each study site
    non_missing_percentage = df.notna().mean() * 100

    # Filter study sites with at least 90% non-missing data
    selected_sites = non_missing_percentage[non_missing_percentage >= 90].index
    df_selected = df[selected_sites]

    # artifical gaps
    df = df_selected.copy()

    np.random.seed(4152)

    if gap_type == 'continuous':

        gaps = {}
        # randomly set a n-day contiguous segment as missing for each column
        random_columns = np.random.choice(df.columns, size=q, replace=False)

        N = len(df.values.flatten())
        m = df.isnull().values.flatten().sum()
        missing_data = m / N * 100

        #print (f'Initial missing data {missing_data:0.1f}%')


        for col in random_columns:
            # Randomly select the start of the n-day segment
            start_idx = np.random.randint(0, len(df) - p)
            end_idx = start_idx + p

            gaps[col] = [start_idx, end_idx]

            # Set the values in this range to NaN
            df.iloc[start_idx:end_idx, df.columns.get_loc(col)] = np.nan

        m = df.isnull().values.flatten().sum()

        missing_data = float(m / N * 100)

        #print (f'Final missing data {missing_data:0.1f}%')


        suffix = f'_{gap_type}_{p}_{q}_{method}'


        with open(f'gaps_{gap_type}_{p}_{q}.yaml', 'w') as file:
            yaml.dump({'gaps': gaps, 'p': p, 'q': q, 'missing': missing_data}, file)
    elif gap_type == 'random':

        # remove randomly selected n days as missing for each column
        for col in df.columns:
            # Randomly sample unique dates
            random_dates = np.random.choice(df.index, size=n, replace=False)

            # Set the values to NaN for those dates
            df.loc[random_dates, col] = np.nan

    else:
        raise Exception(f'Unknown gap_type {gap_type}')

    if 'MF' in method:
        # Imputer
        #clf = RandomForestClassifier(n_jobs=-1, )
        #rgr = RandomForestRegressor(n_jobs=-1, n_estimators=params['n_estimators'])

        #imputer = MissForest(clf, rgr, verbose=1, max_iter=params['max_iter'])

        #imputer = MissForest(**params)
        #df_imputed = imputer.fit_transform(df)

        df_imputed = df.copy()

        df_imputed[:] = imputeMF(df.values, **params)

    elif method == 'LR':
        df_imputed = df.interpolate(method='linear')
    elif 'KNN' in method:
        imputer = KNNImputer(n_neighbors=params['n_neighbors'])
        df_imputed = df.copy()
        df_imputed[:] = imputer.fit_transform(df)
    elif 'MICE' in method:
        mice_data = MICEData(df, k_pmm=7)
        mice_data.update_all(params['n_iterations'])
        df_imputed = df.copy()
        df_imputed[:] = mice_data.data
    else:
        raise Exception(f'Unknown method {method}')

    suffix = f'_{gap_type}_{p}_{q}_{method}'

    # save output
    df_selected.to_csv(f'obs{suffix}.csv')
    df_imputed.to_csv(f'sim{suffix}.csv')
def gof(O, S):
μo = O.mean()
σo = O.std()
μs = S.mean()
σs = S.std()
# bias ratio
β = μs / μo
# variability ratio
γ = (σs/μs) / (σo/μo)
## correlation coefficient
r = O.corrwith(S)
R2 = ((O - μo) * (S - μs)).sum() / (np.sqrt(((O-μo)**2).sum()) * np.sqrt(((S-μs)**2).sum()))
PBIAS = (S - O).sum() / O.sum() * 100
KGE = 1 - np.sqrt((r - 1)**2 + (β - 1)**2 + (γ - 1)**2)
error = O - S
MAE = np.mean(abs(error))
RMSE = np.sqrt(np.mean((error)**2))
return pd.DataFrame({'R2': R2, 'PBIAS': PBIAS, 'KGE': KGE, 'MAE': MAE, 'RMSE': RMSE})method = 'LR'
gap_type = 'continuous'
params = {}
for q in [6, 12, 24]: # number of sites that have missing data
for p in tqdm([7, 14, 21, 35, 56, 91, ]): # gap length
run_experiment(gap_type=gap_type, p=p, q=q, method=method, params=params)
Loading...
gap_type = 'continuous'

n = 7
method = 'KNN'

params = {'n_neighbors' : n}

for q in [6, 12, 24]: # number of sites that have missing data
    for p in tqdm([7, 14, 21, 35, 56, 91, ]): # gap length

        run_experiment(gap_type=gap_type, p=p, q=q, method=method, params=params)
Loading...
gap_type = 'continuous'

n = 3
method = 'MICE'

params = { 'n_iterations': n }

for q in [6, 12, 24]: # number of sites that have missing data
    for p in tqdm([7, 14, 21, 35, 56, 91, ]): # gap length

        run_experiment(gap_type=gap_type, p=p, q=q, method=method, params=params)
Loading...
gap_type = 'continuous'


method = 'MF'

#params = { 'n_iterations': n }
params =  { 'max_iter' : 3}

for q in [6, 12, 24]: # number of sites that have missing data
    for p in tqdm([7, 14, 21, 35, 56, 91, ]): # gap length

        run_experiment(gap_type=gap_type, p=p, q=q, method=method, params=params)
Loading...
method = 'KNN'
gap_type = 'continuous'
p = 91
q = 24

suffix = f'_{gap_type}_{p}_{q}_{method}'
S = pd.read_csv(f'sim{suffix}.csv', parse_dates=True, index_col=0)
O = pd.read_csv(f'obs{suffix}.csv', parse_dates=True, index_col=0)

results = gof(S, O)
plt.figure(figsize=(16,4))
station_id = '57'
plt.plot(O[station_id], label='Original')
plt.plot(S[station_id], label='Imputed')
plt.plot(abs(O[station_id] - S[station_id])+20, label='Error')
plt.legend()
plt.show()---------------------------------------------------------------------------
KeyError Traceback (most recent call last)
File ~/miniforge3/lib/python3.12/site-packages/pandas/core/indexes/base.py:3805, in Index.get_loc(self, key)
3804 try:
-> 3805 return self._engine.get_loc(casted_key)
3806 except KeyError as err:
File index.pyx:167, in pandas._libs.index.IndexEngine.get_loc()
File index.pyx:196, in pandas._libs.index.IndexEngine.get_loc()
File pandas/_libs/hashtable_class_helper.pxi:7081, in pandas._libs.hashtable.PyObjectHashTable.get_item()
File pandas/_libs/hashtable_class_helper.pxi:7089, in pandas._libs.hashtable.PyObjectHashTable.get_item()
KeyError: '57'
The above exception was the direct cause of the following exception:
KeyError Traceback (most recent call last)
Cell In[10], line 4
1 plt.figure(figsize=(16,4))
3 station_id = '57'
----> 4 plt.plot(O[station_id], label='Original')
5 plt.plot(S[station_id], label='Imputed')
6 plt.plot(abs(O[station_id] - S[station_id])+20, label='Error')
File ~/miniforge3/lib/python3.12/site-packages/pandas/core/frame.py:4102, in DataFrame.__getitem__(self, key)
4100 if self.columns.nlevels > 1:
4101 return self._getitem_multilevel(key)
-> 4102 indexer = self.columns.get_loc(key)
4103 if is_integer(indexer):
4104 indexer = [indexer]
File ~/miniforge3/lib/python3.12/site-packages/pandas/core/indexes/base.py:3812, in Index.get_loc(self, key)
3807 if isinstance(casted_key, slice) or (
3808 isinstance(casted_key, abc.Iterable)
3809 and any(isinstance(x, slice) for x in casted_key)
3810 ):
3811 raise InvalidIndexError(key)
-> 3812 raise KeyError(key) from err
3813 except TypeError:
3814 # If we have a listlike key, _check_indexing_error will raise
3815 # InvalidIndexError. Otherwise we fall through and re-raise
3816 # the TypeError.
3817 self._check_indexing_error(key)
KeyError: '57'<Figure size 1600x400 with 0 Axes>performance = {}
gap_types = 'continous'
methods = ['KNN', 'LR', 'MICE', 'MF']
for method in tqdm(methods, desc="Processing"):
performance[method] = { 'R2': { 'x': [], 'y': [] }, 'PBIAS': { 'x': [], 'y': []}, 'KGE': {'x': [], 'y': [] }, 'MAE': { 'x': [], 'y': []}, 'RMSE': {'x': [], 'y': [] } }
for q in [6, 12, 24]:
for p in [7, 14, 21, 35, 56, 91,]:
suffix = f'_{gap_type}_{p}_{q}_{method}'
with open(f'gaps_{gap_type}_{p}_{q}.yaml') as file:
metadata = yaml.safe_load(file)
missing_data = metadata['missing']
O = pd.read_csv(f'obs{suffix}.csv', index_col=0)
S = pd.read_csv(f'sim{suffix}.csv', index_col=0)
results = gof(S, O)
for metric in ['R2', 'PBIAS', 'KGE', 'MAE', 'RMSE']:
performance[method][metric]['x'].append(missing_data)
performance[method][metric]['y'].append(results[metric].mean())
for metric in ['R2', 'PBIAS', 'KGE', 'MAE', 'RMSE']:
performance[method][metric] = pd.DataFrame(performance[method][metric])Loading...
fig, ax = plt.subplots(2, 1, figsize=(10, 6))

methods = ['LR', 'KNN', 'MICE', 'MF']
for i, method in enumerate(methods):

    ax[0].plot(performance[method]['MAE']['x'], performance[method]['MAE']['y'],'o', label=method)
    ax[0].legend()
    ax[0].set_ylabel(r'MAE = $\frac{1}{n}\sum|\hat{y_i} - y_i|$')
    ax[0].set_title('MAE')

    ax[1].plot(performance[method]['RMSE']['x'], performance[method]['RMSE']['y'],'o', label=method)
    ax[1].legend()
    ax[1].set_ylabel(r'RMSE = $\sqrt{\frac{1}{n}\sum(\hat{y_i} - y_i)^2}$')
    ax[1].set_xlabel('Percent missing data')
    ax[0].set_title('RMSE')

plt.show()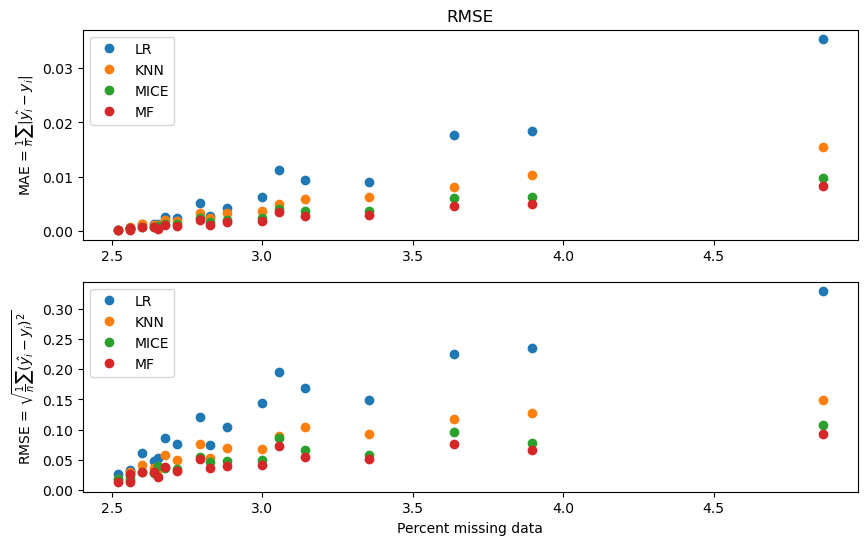
Determine hyperparameter n for KNN
method = 'KNN'
gap_type = 'continuous'

metrics_MAE = []
metrics_RMSE = []
metrics_n = []

for n in tqdm([2,3,5,7,9,11,13,15,19]):
    params = {'n_estimators': 10,
              'max_iter' : 10,
              'n_neighbors' : n}

    method = f'KNN_{n}'

    p = 56 # gap length
    q = 24 # number of sites that have missing data

    run_experiment(gap_type=gap_type, p=p, q=q, method=method, params=params)

    # calculate errors
    suffix = f'_{gap_type}_{p}_{q}_{method}'

    with open(f'gaps_{gap_type}_{p}_{q}.yaml') as file:
        metadata = yaml.safe_load(file)

    missing_data = metadata['missing']

    O = pd.read_csv(f'obs{suffix}.csv', index_col=0)
    S = pd.read_csv(f'sim{suffix}.csv', index_col=0)

    error = O - S
    MAE = np.mean(abs(error))
    RMSE = np.sqrt(np.mean((error)**2))

    metrics_n.append(n)
    metrics_MAE.append(MAE)
    metrics_RMSE.append(RMSE)
Loading...
fig, ax = plt.subplots(2, 1, figsize=(8, 6))

ax[0].set_title(f'Error vs KNN hyperparameter n\np={p} gap length for q={q} sites ({missing_data:.1f}% missing data)')
ax[0].plot(metrics_n, metrics_MAE, 'o')
ax[0].set_xticks(metrics_n)
ax[0].set_ylabel('MAE')
ax[1].plot(metrics_n, metrics_RMSE, 'o')
ax[1].set_ylabel('RMSE')
ax[1].set_xlabel('n')
ax[1].set_xticks(metrics_n)

plt.show()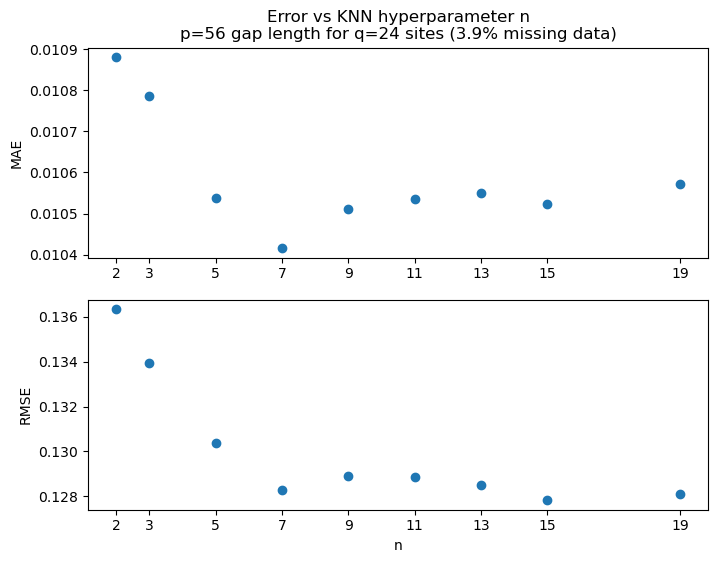
Iterations of MICE
method = 'MICE'
gap_type = 'continuous'

metrics_MAE = []
metrics_RMSE = []
metrics_n = []

for n in tqdm([1, 2, 3, 4, 5, 6]):
    params = { 'n_iterations' : n }

    method = f'MICE_{n}'

    p = 56 # gap length
    q = 24 # number of sites that have missing data

    run_experiment(gap_type=gap_type, p=p, q=q, method=method, params=params)

    # calculate errors
    suffix = f'_{gap_type}_{p}_{q}_{method}'

    with open(f'gaps_{gap_type}_{p}_{q}.yaml') as file:
        metadata = yaml.safe_load(file)

    missing_data = metadata['missing']

    O = pd.read_csv(f'obs{suffix}.csv', index_col=0)
    S = pd.read_csv(f'sim{suffix}.csv', index_col=0)

    error = O - S
    MAE = np.mean(abs(error))
    RMSE = np.sqrt(np.mean((error)**2))

    metrics_n.append(n)
    metrics_MAE.append(MAE)
    metrics_RMSE.append(RMSE)
Loading...
fig, ax = plt.subplots(2, 1, figsize=(8, 6))

ax[0].set_title(f'Error vs MICE iterations\np={p} gap length for q={q} sites ({missing_data:.1f}% missing data)')
ax[0].plot(metrics_n, metrics_MAE, 'o')
ax[0].set_xticks(metrics_n)
ax[0].set_ylabel('MAE')
ax[1].plot(metrics_n, metrics_RMSE, 'o')
ax[1].set_ylabel('RMSE')
ax[1].set_xlabel('n')
ax[1].set_xticks(metrics_n)

plt.show()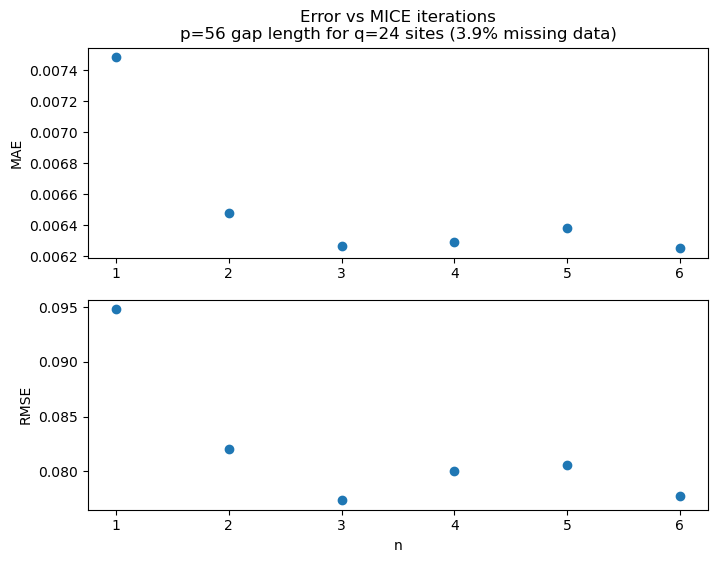
MissForest
method = 'MF'
gap_type = 'continuous'

metrics_MAE = []
metrics_RMSE = []
metrics_n = []

from lightgbm import LGBMClassifier
from lightgbm import LGBMRegressor

for n in tqdm([50, 100]):


    lgbm_clf = LGBMClassifier(verbosity=-1, linear_tree=True)
    lgbm_rgr = LGBMRegressor(n_estimators=n, num_leaves=10, n_jobs=-1)

    params = { 'clf' : lgbm_clf,
               'rgr' : lgbm_rgr,
               'verbose' : 1}

    method = f'MF_{n}'

    p = 56 # gap length
    q = 24 # number of sites that have missing data

    run_experiment(gap_type=gap_type, p=p, q=q, method=method, params=params)

    # calculate errors
    suffix = f'_{gap_type}_{p}_{q}_{method}'

    with open(f'gaps_{gap_type}_{p}_{q}.yaml') as file:
        metadata = yaml.safe_load(file)

    missing_data = metadata['missing']

    O = pd.read_csv(f'obs{suffix}.csv', index_col=0)
    S = pd.read_csv(f'sim{suffix}.csv', index_col=0)

    error = O - S
    MAE = np.mean(abs(error))
    RMSE = np.sqrt(np.mean((error)**2))

    metrics_n.append(n)
    metrics_MAE.append(MAE)
    metrics_RMSE.append(RMSE)


print(metrics_MAE)
print(metrics_RMSE)
Loading...
fig, ax = plt.subplots(2, 1, figsize=(8, 6))

ax[0].set_title(f'Error vs MissForest n_estimators\np={p} gap length for q={q} sites ({missing_data:.1f}% missing data)')
ax[0].plot(metrics_n, metrics_MAE, 'o')
ax[0].set_xticks(metrics_n)
ax[0].set_ylabel('MAE')
ax[1].plot(metrics_n, metrics_RMSE, 'o')
ax[1].set_ylabel('RMSE')
ax[1].set_xlabel('n')
ax[1].set_xticks(metrics_n)

plt.show()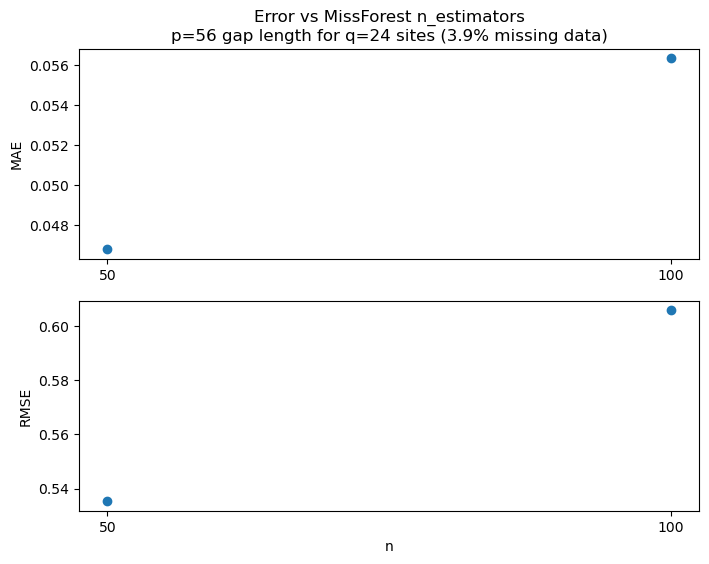
performance = {}
gap_types = ['continuous']

for gap_type in gap_types:

    performance[gap_type] = { 'R2': {}, 'PBIAS': {}, 'KGE': {} }

    for q in [12, 24]:
        for p in [7, 14, 21, 35]:
            for method in ['LR', 'KNN']:
                suffix = f'_{gap_type}_{p}_{q}_{method}'

                O = pd.read_csv(f'obs{suffix}.csv', index_col=0)
                S = pd.read_csv(f'sim{suffix}.csv', index_col=0)

                results = gof(S, O)

                position = f'{p}_{q} {method}'
                performance[gap_type]['R2'][position] = results['R2']
                performance[gap_type]['PBIAS'][position] = results['PBIAS']
                performance[gap_type]['KGE'][position] = results['KGE']

    for metric in ['R2', 'PBIAS', 'KGE']:
        performance[gap_type][metric] = pd.DataFrame(performance[gap_type][metric])
2211
450
2211
0
2211
450
2211
0
2211
450
2211
0
2211
458
2211
0
2211
450
2211
0
2211
450
2211
0
2211
450
2211
0
2211
458
2211
0
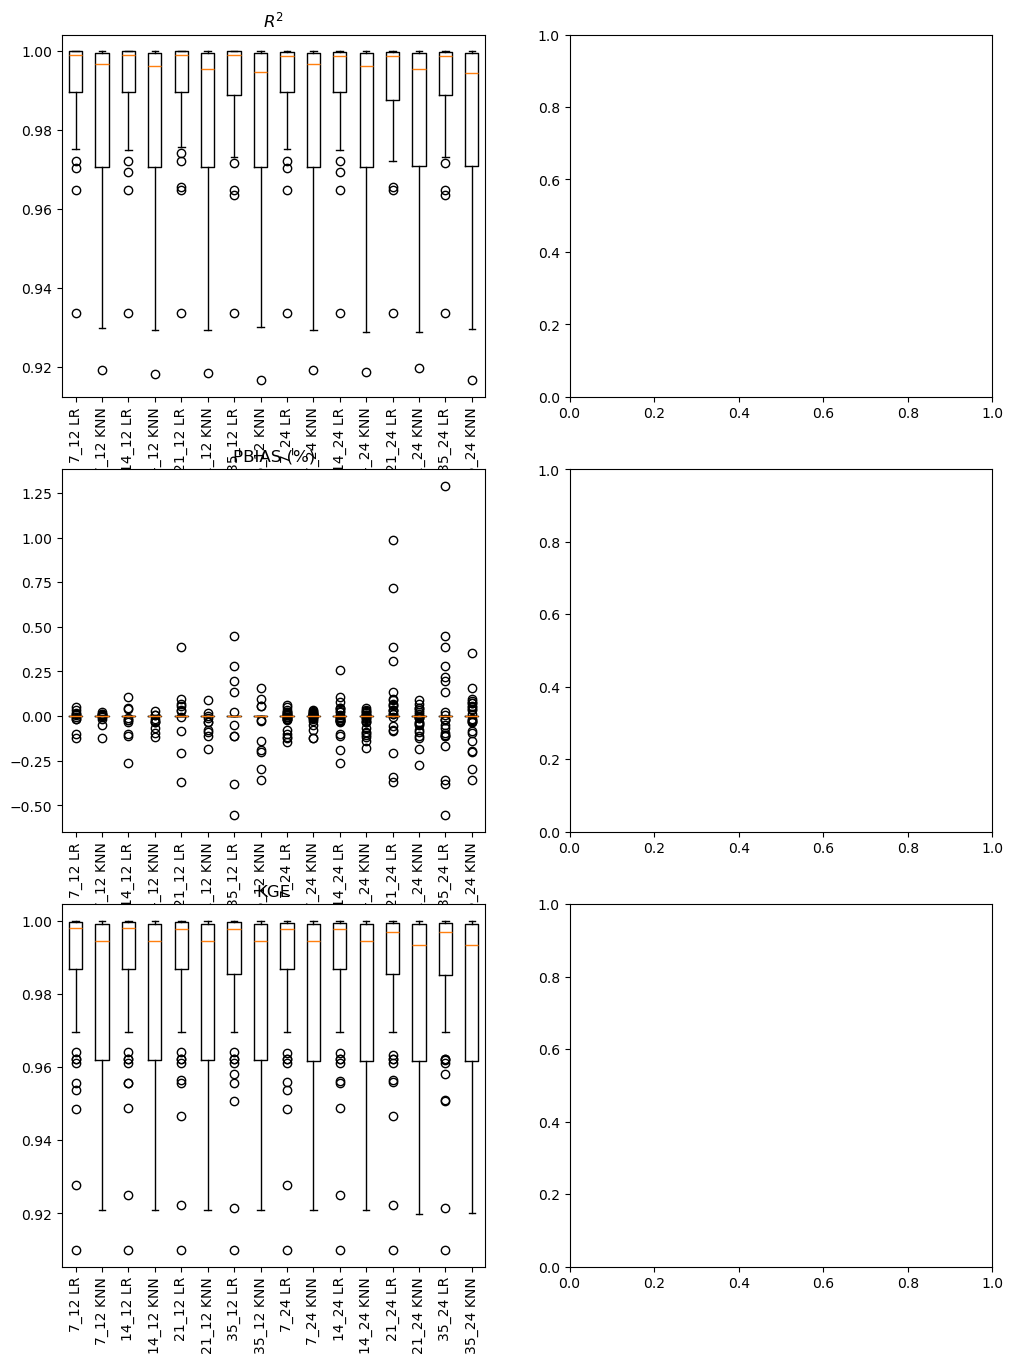
fig, ax = plt.subplots(3, 2, figsize=(12, 16))

for i, gap_type in enumerate(gap_types):
    labels = list(performance[gap_type]['R2'].columns)

    ax[0,i].boxplot(performance[gap_type]['R2'])
    ax[0,i].set_xticklabels(labels, rotation=90)
    ax[0,i].set_title('$R^2$')

    ax[1,i].boxplot(performance[gap_type]['PBIAS'])
    ax[1,i].set_xticklabels(labels, rotation=90)
    ax[1,i].set_title('PBIAS (%)')

    ax[2,i].boxplot(performance[gap_type]['KGE'])
    ax[2,i].set_xticklabels(labels, rotation=90)
    ax[2,i].set_title('KGE')

plt.show()