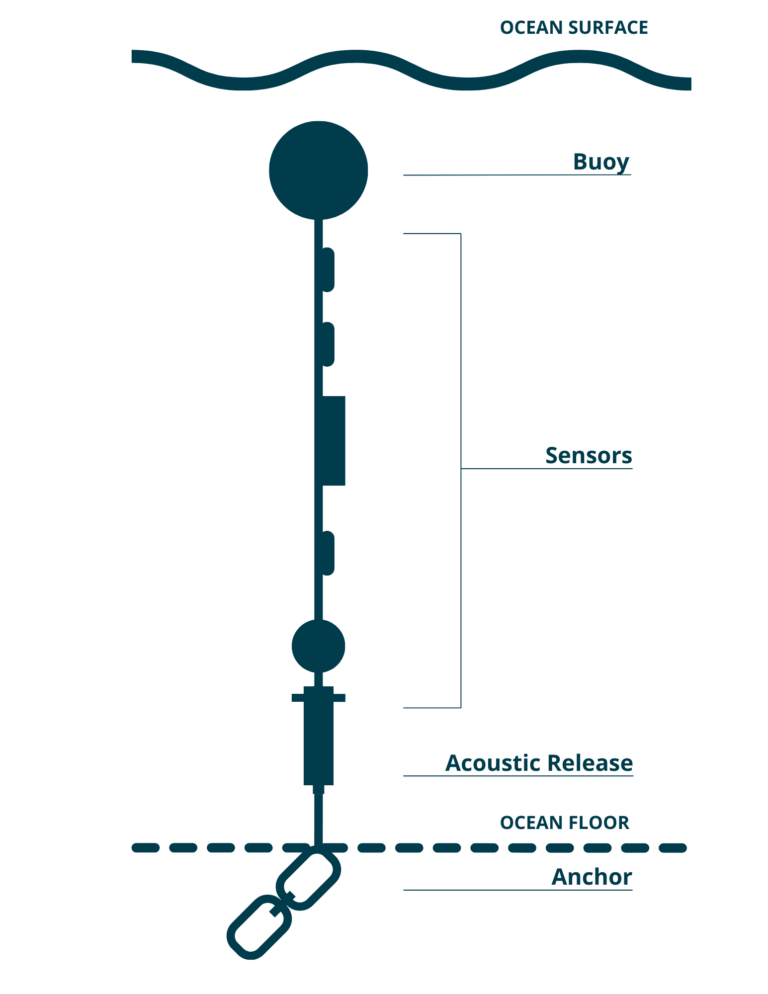
We want to analyze the Centre for Marine Applied Research (CMAR) Water Quality dataset.


from erddapy import ERDDAP
import os
import pandas as pd
from tqdm.notebook import tqdm
The data is available from CIOOS Atlantic
e = ERDDAP(
    server = "https://cioosatlantic.ca/erddap",
    protocol = "tabledap"
)
Determine the datasetID for each CMAR Water Quality dataset.
The study period is 2020-09-01 to 2024-08-31.
e.dataset_id = 'allDatasets'
e.variables = ['datasetID', 'institution', 'title', 'minTime', 'maxTime']

# only grab data from county with data within study period
e.constraints = {'maxTime>=': '2020-09-01', 'minTime<=': '2024-08-31'}
df_allDatasets = e.to_pandas()
df_CMAR_datasets = df_allDatasets[df_allDatasets['institution'].str.contains('CMAR') & df_allDatasets['title'].str.contains('Water Quality Data')].copy()
df_CMAR_datasets['county'] = df_CMAR_datasets['title'].str.removesuffix(' County Water Quality Data')
df_CMAR_datasets.sample(5)For each of these datasets, we download the temperature data locally.
e.variables = [
 'waterbody',
 'station',
# 'sensor_type',
# 'sensor_serial_number',
# 'rowSize',
# 'lease',
# 'latitude',
# 'longitude',
 'deployment_start_date',
 'deployment_end_date',
# 'string_configuration',
 'time',
 'depth',
# 'depth_crosscheck_flag',
# 'dissolved_oxygen',
# 'salinity',
# 'sensor_depth_measured',
 'temperature',
# 'qc_flag_dissolved_oxygen',
# 'qc_flag_salinity',
# 'qc_flag_sensor_depth_measured',
 'qc_flag_temperature']

e.constraints = { "time>=": "2020-09-01", "time<=": "2024-08-31" }
This takes a few minutes so we locally cache the data so it only has to be downloaded once.
%%time

os.makedirs('data', exist_ok=True)

for index, row in df_CMAR_datasets.iterrows():

    csvfile = f"data/{row['county']}.csv"

    if os.path.exists(csvfile):
        continue

    print(f"Downloading {row['title']}...")
    e.dataset_id = row['datasetID']
    df = e.to_pandas()

    df.to_csv(csvfile, index=False)
Downloading Annapolis County Water Quality Data...
Downloading Antigonish County Water Quality Data...
Downloading Colchester County Water Quality Data...
Downloading Digby County Water Quality Data...
Downloading Guysborough County Water Quality Data...
Downloading Halifax County Water Quality Data...
Downloading Inverness County Water Quality Data...
Downloading Lunenburg County Water Quality Data...
Downloading Pictou County Water Quality Data...
Downloading Queens County Water Quality Data...
Downloading Richmond County Water Quality Data...
Downloading Shelburne County Water Quality Data...
Downloading Victoria County Water Quality Data...
Downloading Yarmouth County Water Quality Data...
CPU times: user 43.8 s, sys: 5.44 s, total: 49.3 s
Wall time: 26min 59s
We now have the following .csv files stored locally:
!ls -lh data/total 2.4G
-rw-r--r-- 1 jmunroe jmunroe 33M Jul 4 09:14 Annapolis.csv
-rw-r--r-- 1 jmunroe jmunroe 106M Jul 4 09:16 Antigonish.csv
-rw-r--r-- 1 jmunroe jmunroe 32M Jul 4 09:16 Colchester.csv
-rw-r--r-- 1 jmunroe jmunroe 122M Jul 4 09:18 Digby.csv
-rw-r--r-- 1 jmunroe jmunroe 940M Jul 4 09:27 Guysborough.csv
-rw-r--r-- 1 jmunroe jmunroe 177M Jul 4 09:29 Halifax.csv
-rw-r--r-- 1 jmunroe jmunroe 40M Jul 4 09:29 Inverness.csv
-rw-r--r-- 1 jmunroe jmunroe 395M Jul 4 09:33 Lunenburg.csv
-rw-r--r-- 1 jmunroe jmunroe 47M Jul 4 09:34 Pictou.csv
-rw-r--r-- 1 jmunroe jmunroe 72M Jul 4 09:35 Queens.csv
-rw-r--r-- 1 jmunroe jmunroe 88M Jul 4 09:36 Richmond.csv
-rw-r--r-- 1 jmunroe jmunroe 143M Jul 4 09:38 Shelburne.csv
-rw-r--r-- 1 jmunroe jmunroe 183K Jul 4 09:38 Victoria.csv
-rw-r--r-- 1 jmunroe jmunroe 183M Jul 4 09:40 Yarmouth.csv
We need to organize and sort the observations so that we are considering only the observation for a single sensor in temporal order.
This will remove all of the duplicated metadata within this .csv files.
os.makedirs('segments', exist_ok=True)

all_segment_metadata = []
for index, row in tqdm(list(df_CMAR_datasets.iterrows())):

    csvfile = f"data/{row['county']}.csv"

    df = pd.read_csv(csvfile)

    df['segment'] = df[['waterbody', 'station', 'depth (m)',
                     'deployment_start_date (UTC)', 'deployment_end_date (UTC)',
                     ]].agg(lambda x: row['county'] + '_' + '_'.join([str(y) for y in x]), axis=1)

    df_metadata = df[['segment', 'waterbody', 'station', 'depth (m)',
                     'deployment_start_date (UTC)', 'deployment_end_date (UTC)',
                     ]]

    df_metadata = df_metadata.drop_duplicates()
    all_segment_metadata.append(df_metadata)

    df_data = df.drop(columns=['waterbody', 'station', 'depth (m)',
                                 'deployment_start_date (UTC)', 'deployment_end_date (UTC)',
                              ])

    df_data = df_data.sort_values(by=['segment', 'time (UTC)'])

    df_data.set_index(['segment', 'time (UTC)'], inplace=True)

    for key, segment_df in df_data.groupby(level=0):
        csvfile = f'segments/{key}.csv'
        segment_df = segment_df.droplevel(0)
        segment_df.to_csv(csvfile)

df_metadata = pd.concat(all_segment_metadata)
df_metadata.set_index('segment', inplace=True)
df_metadata.to_csv('metadata.csv')!ls -lh segments/ | wc 1108 12698 151581
We have 852 distinct observational time series taken at various locations and depths around Nova Scotia during the period of 2020-09-01 to 2024-08-31
df_metadata.head(8)