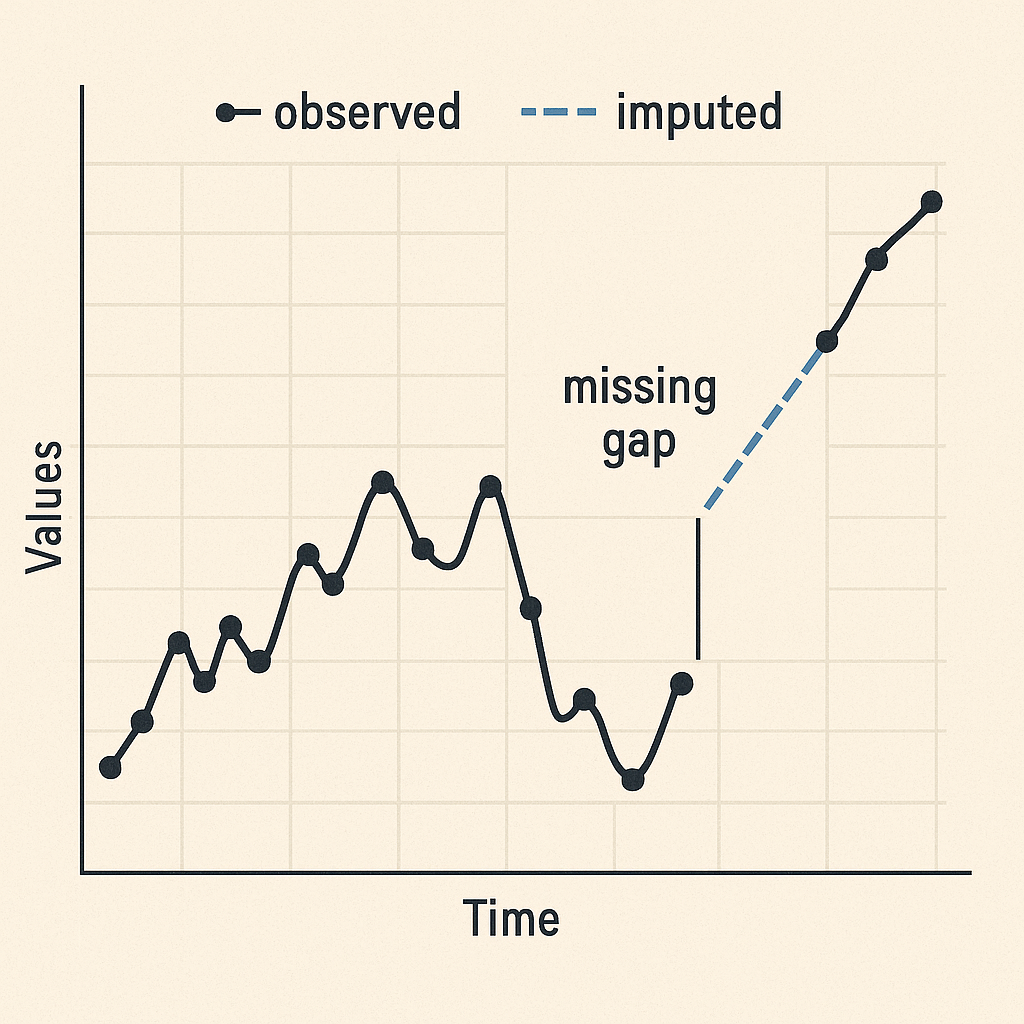
Oceanographic time series, like many observational measurements based on physical sensors, are often incomplete. Due to sensor limitations, interference, malfunctions and other concerns, there is often missing data, or data that has failed a quality control check. Before these datasets can be used in subsequent data analysis workflows, it may be necessary to gap fill (or “impute”) the missing or suspect data.
While simple univariate methods may suffice for short gaps, they are not sufficiently accurate for longer gaps. In such instances, machine learning methods are an attractive option: these multivariate solutions estimate missing data by examining the relationship between two (or more) variables in order to predict patterns. These variables might be ocean observations recorded at the same location, or may be observations from multiple sites–such as different depths or geographically-adjacent locations.
To demonstrate the concept, this series of notebooks documents the comparison of several machine learning methods for imputation of time series. The time series chosen for analysis was the Center for Marine Applied Research (CMAR) Water Quality datasets hosted at CIOOS Atlantic, using data collected over a four-year period. To validate the approach, a dataset from the East Atlantic Coast Aquatic Invasive Species (AIS) Monitoring Program is also presented.
In both case studies missForest provided the best compromise between accuracy and speed of analysis. Although this is consistent with the literature, these examples explore only a small subset of oceanographic data, and we do not allege that this solution is optimal in all circumstances–the optimal algorithm may depend on the features of the dataset.
How do I use these notebooks when working with my own data?
Depending on your needs, there are two ways to approach this content:
Impute your data with missForest ✏️
I have time series from multiple locations that include gaps that I need to infill. I want to use the tools presented here to apply a data imputation algorithm like missForest to impute the missing data
Start with 09_CaseStudy_BYOD.ipynb as a template using 06_CaseStudy_Shelburne.ipynb and 07_CaseStudy_AIS.ipynb worked examples.
Compare imputation algorithms on your data✨
I have a historical time series from multiple locations and I want to compare and contrast different imputation algorithms to help me choose the right algorithm for me use case. I want to know if missForest is the still the right recommendation for my data set or if I should select a different algorithm.
Use 08_CaseStudy_CMAR.ipynb as an example and 10_Compare_Algorithms.ipynb as reusable template.
This project is an outcome of Building Bridges, a project funded by Canada’s Oceans Supercluster.
Outline
Introduction: this notebook
Data Exploration: always begin with visualizing your data
Imputation: the different imputation algorithms we are considering in this analysis
Experiments: demonstration that for the datasets considered, the
missForestalgorithm performs bestCase Study: Shelborne County Water Quality
Case Study: AIS
Case Study: CMAR Water Quality
Case Study: Bring your own data!
Compare different imputation algorithms
Appendix: Hyperparameter tuning
Appendix: Various additional visualization routines